
Using ChatOps interfaces for website auditing and performance tracking over time
Using ChatOps interfaces for website auditing and performance tracking over time
Every web developer wants to build a website that adheres to the almost mythical “best practices” so that it is light and performant.
But how exactly are developers supposed to measure performance? And what is considered to be a best practice when it comes to developing for the web?
To solve the problems outlined above, Google created Lighthouse, a toolset that audits a site of your choice for a number of key metrics that relate to five different categories:
- Performance
- Accessibility
- Best Practices
- Search Engine Optimization
- Progressive Web App
This allows developers working on a new site to quickly test how their website performs against each metric, and Google provides a detailed report with customized tips for how to improve the metrics of your particular site.
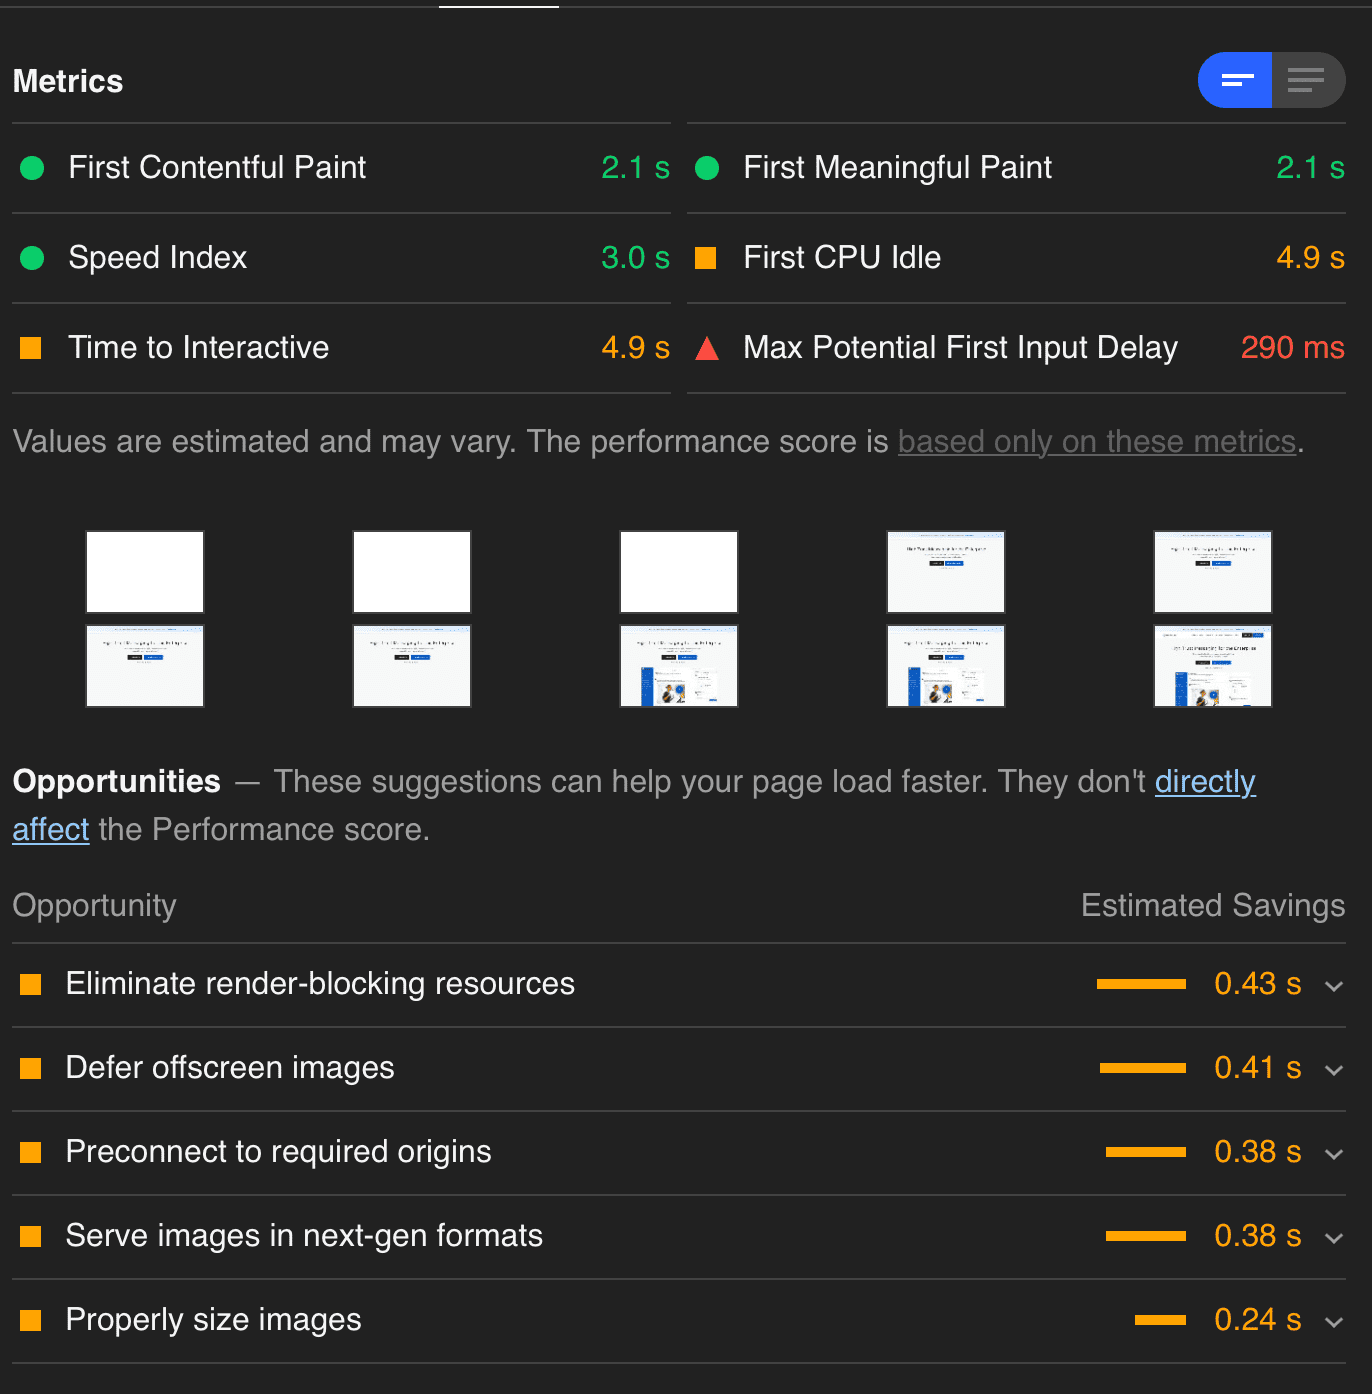
Lighthouse checks as many as 80 different metrics for the 5 available categories and leaves you with a clear gameplan of how you'd be able to improve each metric.
Limitations
One of the leading reasons why a tool as good as Lighthouse has struggled to gain significant popularity is because of how hard it is to integrate it into the regular workflow of developers. The easiest way to currently use it requires you to remember to visit the Audit tab of the Chrome dev tools and manually run an audit.
But even when running it on the Audit tab, the performance metrics may wildly vary depending on your internet connection or the processes running in the background of your computer.
The only valid alternative that doesn’t run into the first two problems is setting a CI/CD pipeline to run periodic audits against your website. But this method requires you to have prior knowledge in setting up CI/CD pipelines, and it also makes it difficult to view past reports or track their performance over time.
@ChatOps joined the channel
Creating a containerized Mattermost chatbot server offers the same benefits as running CI/CD pipelines with regards to getting consistent performance results, with the added benefit of giving you full control of how and when your audits are run.
Some of this chatbot’s main features are as follows.
- Running ad-hoc audits on websites or scheduling periodic runs and viewing the results directly on a Mattermost channel of your choice
- Testing pages hidden behind an authentication screen by injecting a script for your login session that can be as simple as this:
(() => {
 document.querySelector('#loginId').value = 'username';
 document.querySelector('#loginPassword').value = 'password';
 document.querySelector('#loginButton').click();
})();
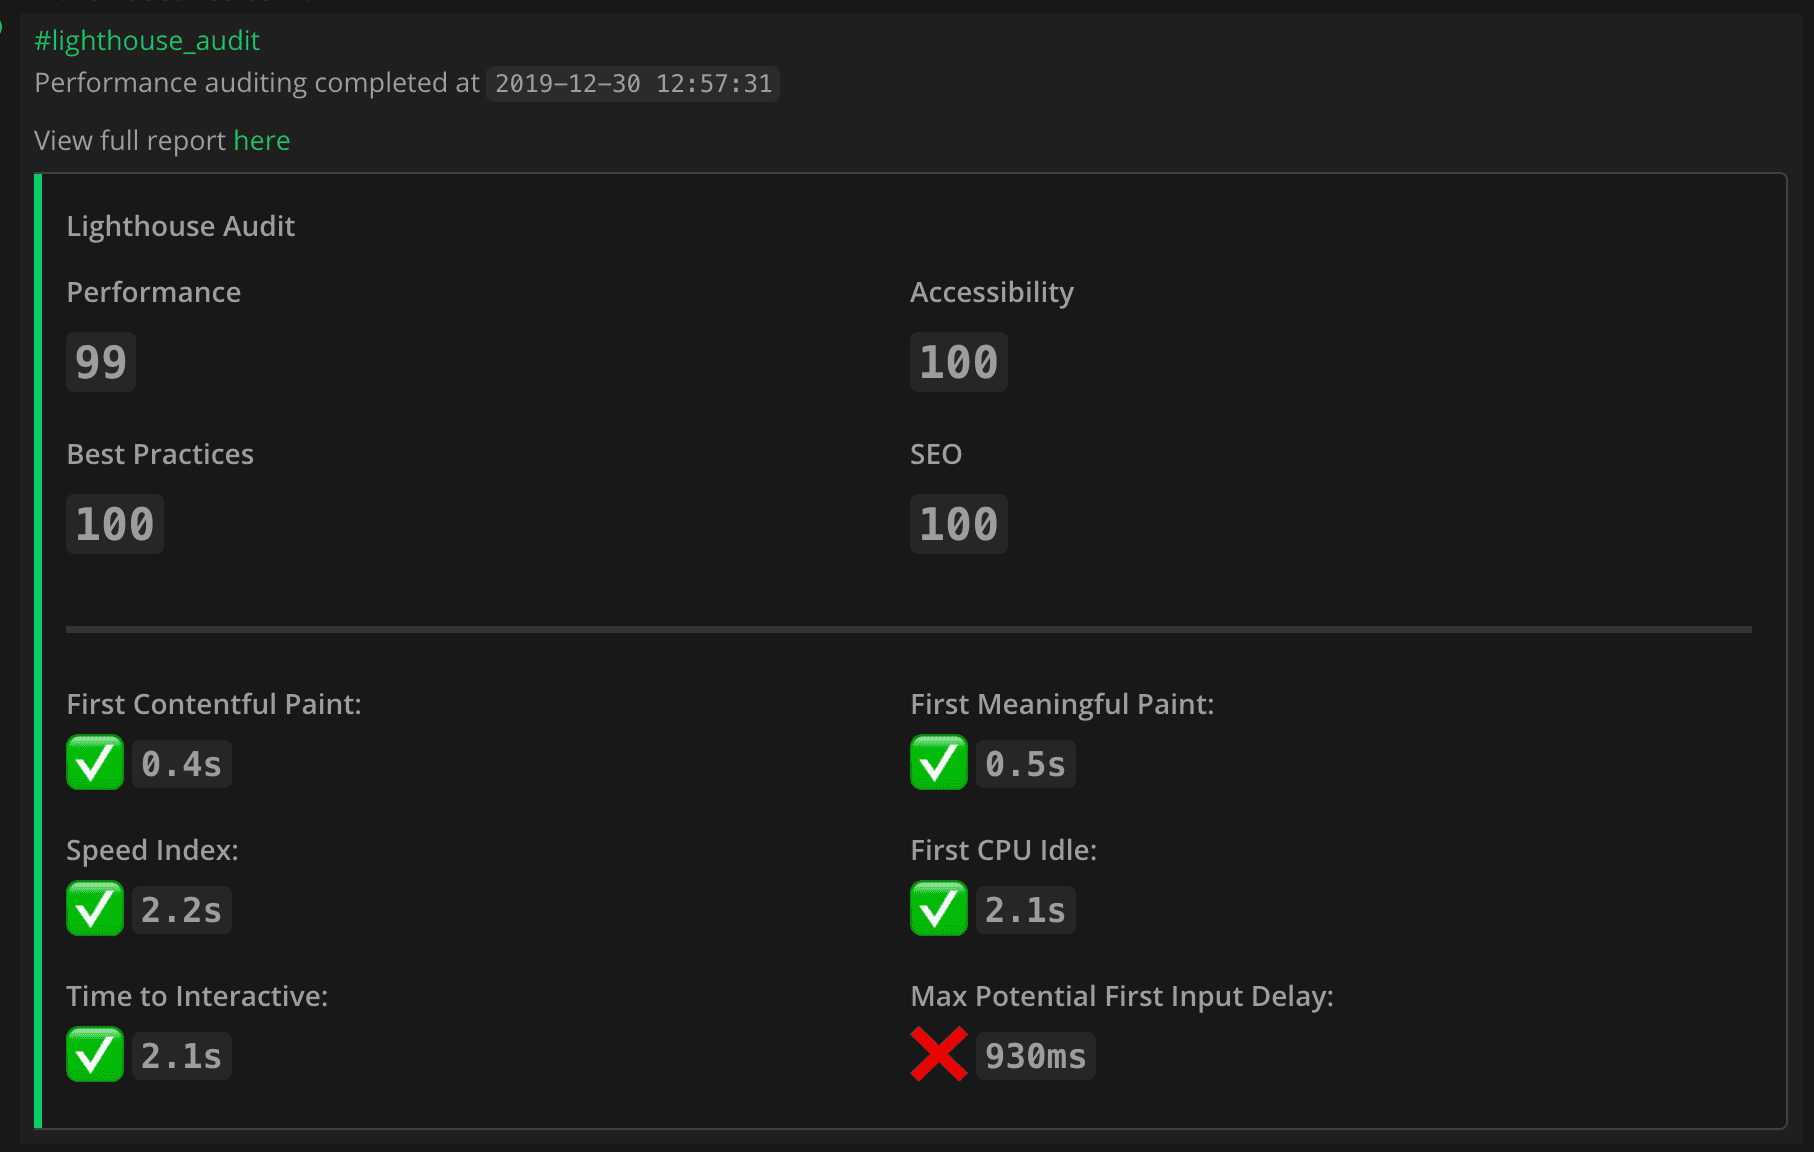
- Having audit results persisted on MongoDB allows you to have complete access to the history of past audits, which is easily accessible by clicking the
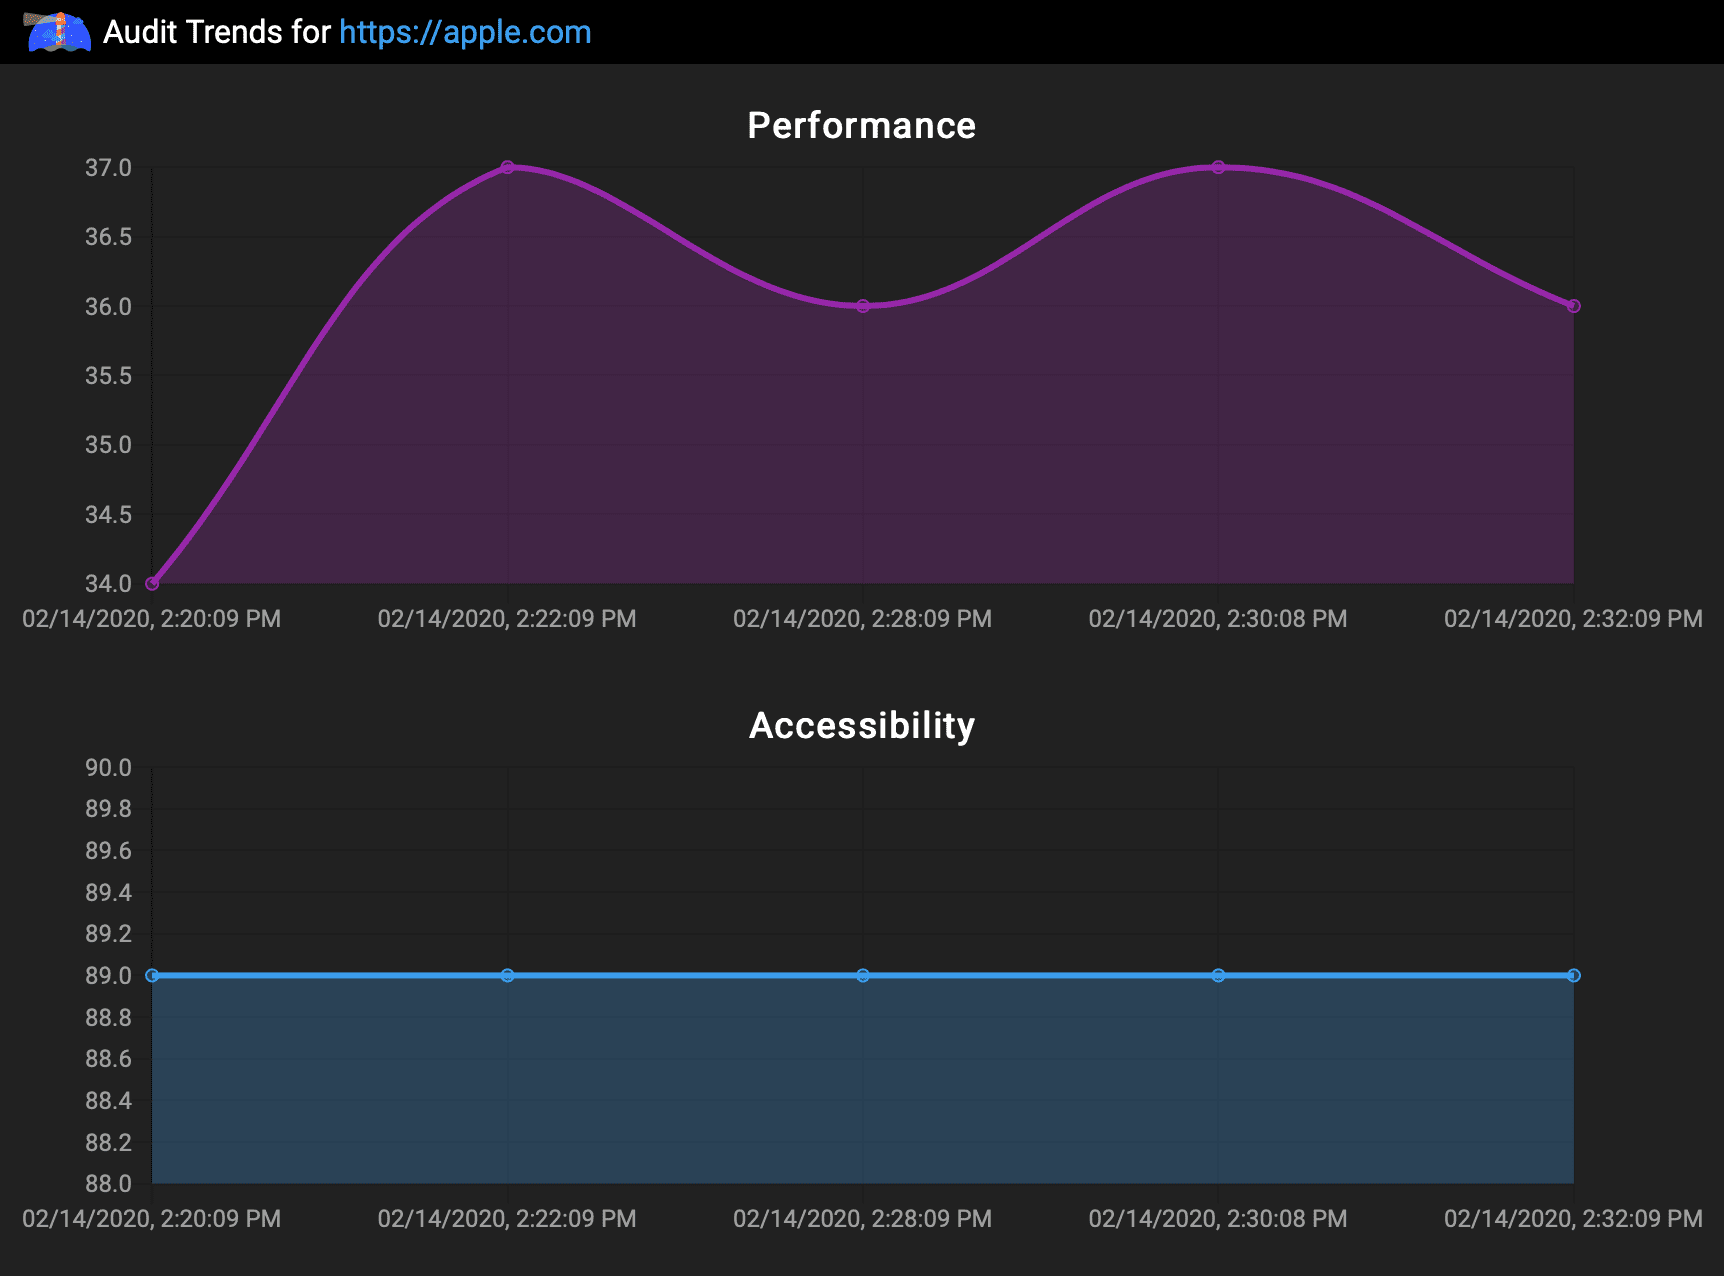
View full report herebutton on any in-channel report. - Viewing trend charts of how the latest audit compares to past results on each of the five audit categories after running at least two audits on a given URL.
For more information on the original project and instructions for setup, go here